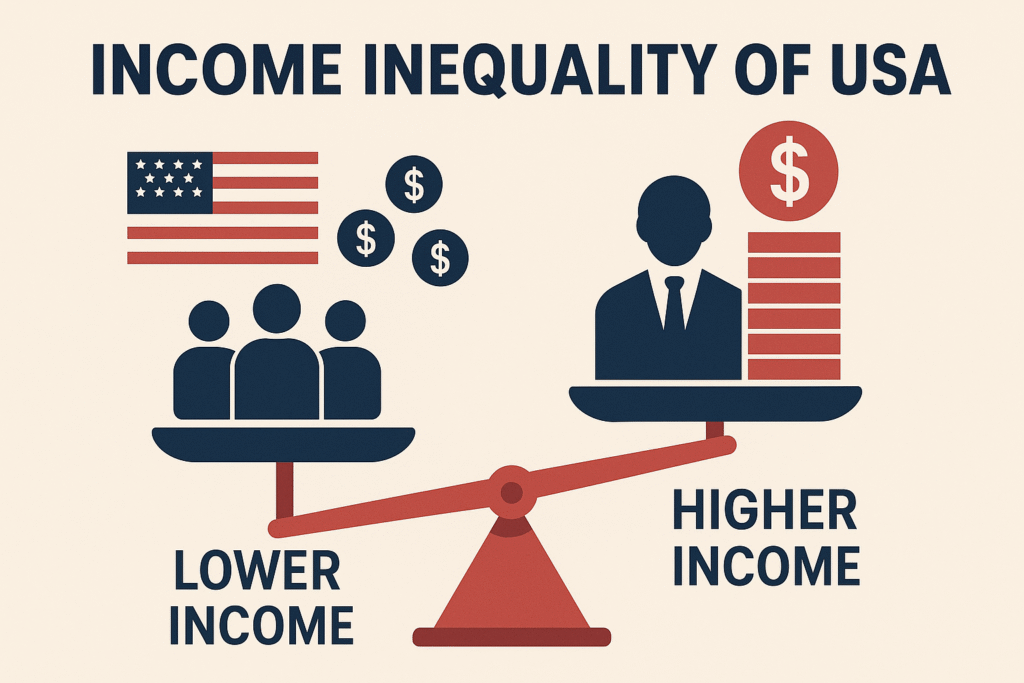
The United States presents a paradox of unparalleled wealth generation coexisting with staggering income inequality. While the U.S. economy has expanded dramatically over the past four decades, the benefits have flowed overwhelmingly to those at the very top. By 2021, the top 1% of households earned over 20% of all national income—the highest share since the Gilded Age—while the bottom 50% claimed just 13%.

Between 1979 and 2021, the average income of the top 0.01% surged by 1,003% after taxes and transfers, dwarfing the 132% growth for the bottom 20%. Worker productivity grew 80.9% from 1979 to 2024, but average hourly compensation rose just 29.4% after inflation. This “productivity-pay gap” means workers generated far more value than they received. Wealth inequality eclipses income disparities: the top 3% of households hold 54.4% of America’s wealth, while the bottom 90% own just 24.7%—a 33% decline since 1989.
Multiple forces drive this divide. Union membership plummeted from 30% in the mid-20th century to 10.1% in 2022, weakening collective bargaining. Non-union workers earn just 81 cents for every dollar union members make. Globalization and automation suppressed wages for middle- and low-income workers while boosting corporate profits and executive pay. Winner-take-all dynamics in technology and finance concentrate rewards—CEOs now earn 350x typical workers vs. 40x in the 1970s. Tax policy favors the wealthy: the top marginal tax rate fell from 70% in 1979 to 37% in 2021, while capital gains (which benefit the rich) face a maximum 20% rate.
Systemic barriers deepen disparities. Black workers earn 24% less than white peers, and women earn 38% less than similarly educated men. School funding based on local property taxes entrenches opportunity gaps.
Table: Cumulative Income Growth by Group (1979–2021, After Taxes & Transfers)
| Income Group | Growth Rate | Key Drivers |
|---|---|---|
| Top 0.01% | 1,003% | Capital gains, executive pay, tax cuts |
| Top 1% | 226% | Stock options, business ownership |
| Bottom 20% | 132% | EITC expansions, pandemic relief (temporary) |
| Middle 60% | <100% | Stagnant wages, rising costs |
| Source: Congressional Budget Office Data |
The consequences extend beyond economics. The U.S. ranks 40+ globally in life expectancy, lagging peer nations by 7.5 years—linked to stress from financial insecurity. Wealth concentration enables outsized political influence, fueling polarization. High inequality also correlates with low intergenerational mobility, trapping children in poverty.
Solutions exist. Restoring higher marginal tax rates on top incomes and equalizing capital gains taxes could fund social investments. Protecting union organizing and raising the minimum wage to $15 would lift 32 million workers. Universal pre-K and paid family leave—standard in peer nations—improve long-term outcomes. Combining interventions (wage subsidies + skills training + childcare) creates powerful synergies, as seen in successful international models.
Income inequality reflects decades of policy choices, not inevitability. With 61% of Americans now deeming inequality “excessive,” momentum exists for reforms that build healthier, more democratic, and more prosperous communities.


